Use Grafana to Manage GitLab CI/CD Pipelines
Overview
Change log
- 2022/10/13: Add some check points.
Requirement
When there are lots of projects on GitLab, it's not easy to know the overall build status of their CI/CD Pipelines.
Use Grafana to Manage GitLab CI/CD Pipelines
Solution 1: Use GitLab build-in metrics
- Exporter: GitLab build-in (reference: https://docs.gitlab.com/ee/administration/monitoring/prometheus/)
-
Grafana dashboard:
https://grafana.com/grafana/dashboards/10620
- This dashboard needs this plugin: https://grafana.com/grafana/plugins/grafana-polystat-panel/
-
prometheus.yml
1- job_name: 'GitLab'
2    scrape_interval: 5s
3    metrics_path: '/-/metrics'
4    scheme: https
5    static_configs:
6    - targets: ['gitlab.xxx.xxx.xxx']
7    params:
8    token: ['***************']
Solution 2: Use gitlab-ci-pipelines-exporter
- Exporter: https://github.com/mvisonneau/gitlab-ci-pipelines-exporter This exporter provides several spectives metrics (with different Grafana dashboards)
-
Grafana dashboard: the same as solution 1 (it also needs Ploystat plugin)
-
How to start gitlab-ci-pipelines-exporter
-
Assume you put gitlab-ci-pipelines-exporter's configuration at /opt/grafana/gitlab-ci-pipelines-exporter/gitlab-ci-pipelines-exporter.yml
1server: 2# [address:port] to make the process listen 3# upon (optional, default: :8080) 4listen_address: :9103 5gitlab: 6url: https://gitlab.xxx.xxx.xxx/ 7# You can also configure the token using --gitlab-token 8# or the $GCPE_GITLAB_TOKEN environment variable 9token: xrN14n9-ywvAFxxxxxx 10project_defaults: 11pull: 12 pipeline: 13 jobs: 14 enabled: true 15 environments: 16 enabled: true 17 18wildcards: 19- owner: 20 name: g1 21 kind: group 22 include_subgroups: true -
You can run this command to start this exporter in docker
1docker run --restart always \ 2--name gitlab-ci-pipelines-exporter \ 3-v /opt/gitlab-runner/gitlab-ci-pipelines-exporter.yml:/etc/config.yml \ 4-v /etc/hosts:/etc/hosts \ 5--expose 9103 \ 6-p 9103:9103 \ 7mvisonneau/gitlab-ci-pipelines-exporter:v0.5.3 \ 8run --config /etc/config.yml -
If you use docker-compose, you can reference the following yml
1gitlab-ci-pipelines-exporter: 2image: mvisonneau/gitlab-ci-pipelines-exporter:v0.5.3 3container_name: gitlab-ci-pipelines-exporter 4ports: 5- 9103:9103 6expose: 7- 9103 8volumes: 9- /opt/grafana/gitlab-ci-pipelines-exporter/gitlab-ci-pipelines-exporter.yml:/etc/gitlab-ci-pipelines-exporter.yml 10- /etc/hosts:/etc/hosts 11environment: 12 GCPE_CONFIG: /etc/gitlab-ci-pipelines-exporter.yml 13 #GCPE_GITLAB_TOKEN: ${GCPE_GITLAB_TOKEN} 14 #GCPE_INTERNAL_MONITORING_LISTENER_ADDRESS: tcp://127.0.0.1:8082 -
How to check: You can connect to http://your.server:9103/metrics, and you should see some metrics start like "gitlab_ci_pineline_xxxx" If you only see metrics like "gcpe_projects_***" and "promhttp_metric_handler_errors_total", you may need to check your configuration.
 1# TYPE gitlab_ci_pipeline_coverage gauge
 2gitlab_ci_pipeline_coverage{kind="branch",project="******",ref="master",topics="",variables=""} 0
 3gitlab_ci_pipeline_coverage{kind="branch",project="******",ref="master",topics="",variables=""} 0
 4# HELP gitlab_ci_pipeline_duration_seconds Duration in seconds of the most recent pipeline
 5# TYPE gitlab_ci_pipeline_duration_seconds gauge
 6gitlab_ci_pipeline_duration_seconds{kind="branch",project="******",ref="master",topics="",variables=""} 253
 7gitlab_ci_pipeline_duration_seconds{kind="branch",project="******",ref="master",topics="",variables=""} 489
 8# HELP gitlab_ci_pipeline_id ID of the most recent pipeline
 9# TYPE gitlab_ci_pipeline_id gauge
10gitlab_ci_pipeline_id{kind="branch",project="******",ref="master",topics="",variables=""} 811
11gitlab_ci_pipeline_id{kind="branch",project="******",ref="main",topics="",variables=""} 823
12......
-
-
prometheus.yml
1- job_name: 'gitlab-runner-ci-pipeline' 2 metrics_path: '/metrics' 3 scrape_interval: 5s 4 scheme: http 5 bearer_token: bearer_token 6 static_configs: 7 - targets: ['xxx.xxx.xxx.xxx:9103'] -
Result
-
Solution 1 and 2 use the same dashboard, like the following:
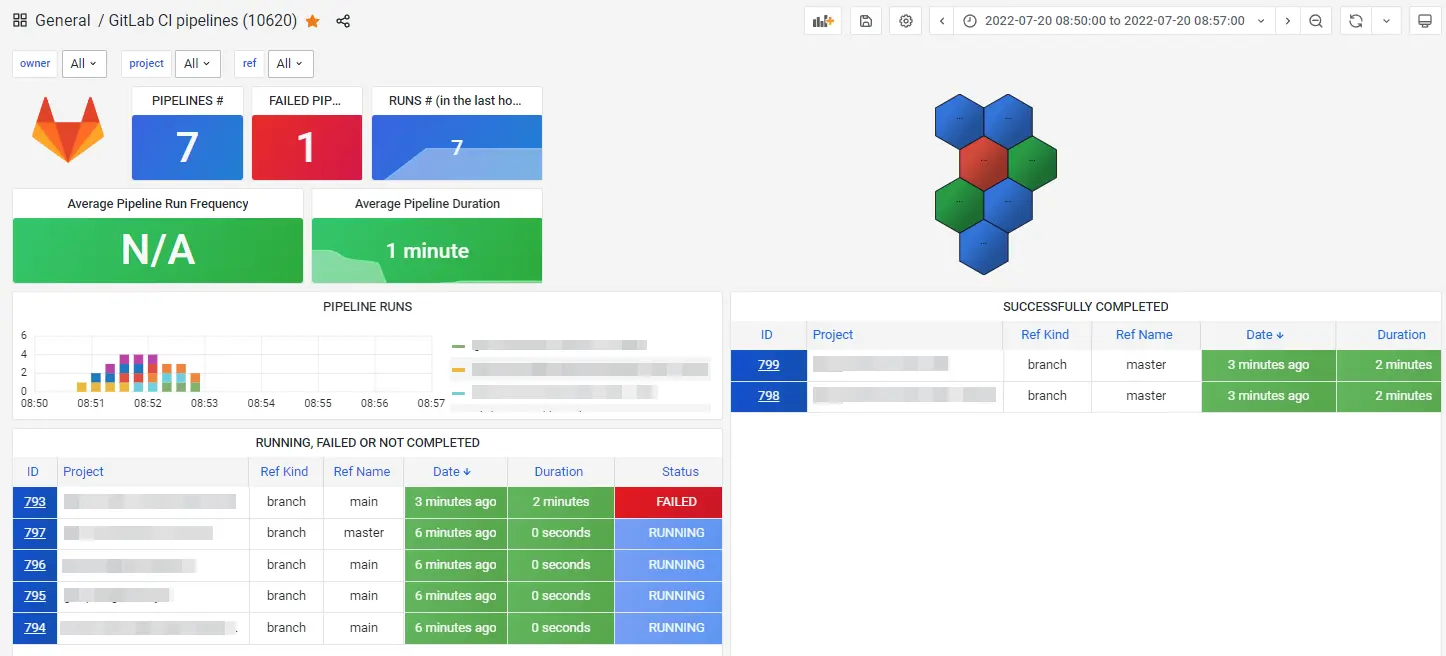
-
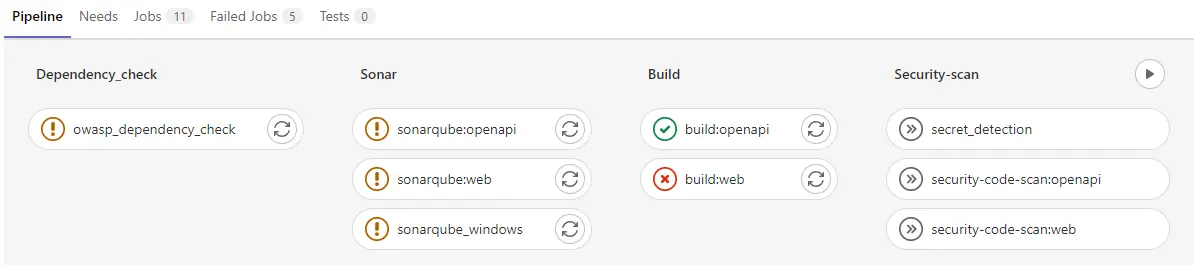
And you can click the ID, it will forward to GitLab's CI/CD Pipelines, you can see every jobs' execution status.
-
Job status of CI Pipelines
-
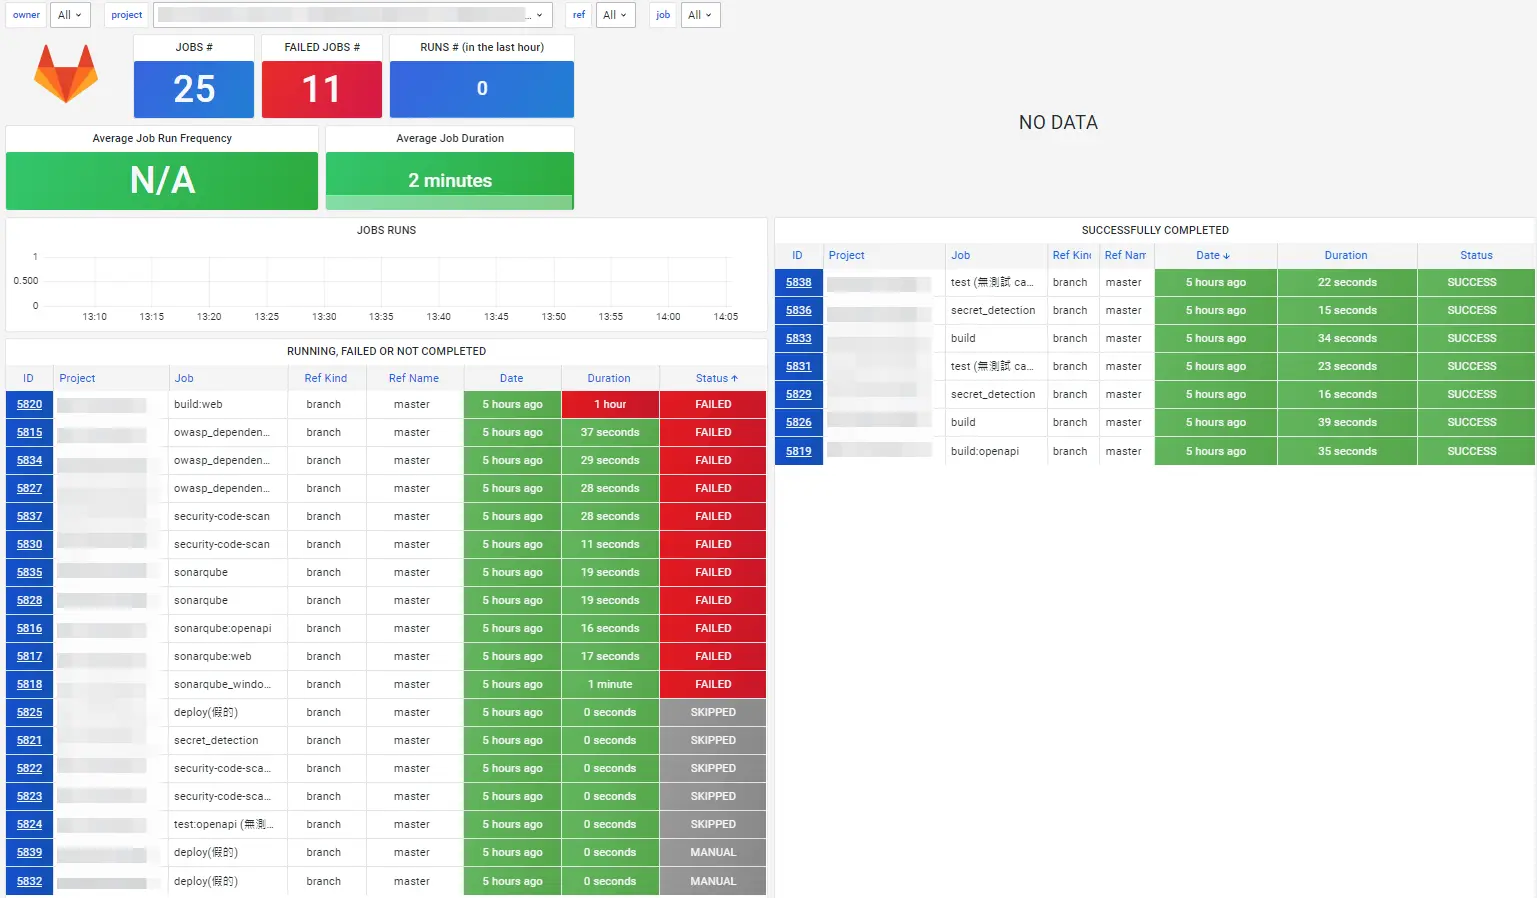
The above solution is to check the entire CI pipeline results, if you want to see individual job status in Grafana, you can modify gitlab-ci-pipelines-exporter.yml to add lines 5~6. And you can install this Grafana dashboard https://grafana.com/grafana/dashboards/13328
1# Pull jobs related metrics on all projects 2project_defaults: 3pull: 4 pipeline: 5 jobs: 6 enabled: true -
Result
-
You can see every job's execution time and result, and you
can click ID to see the detail in GitLab.
-
You can see every job's execution time and result, and you
can click ID to see the detail in GitLab.
Environments / Deployments status
I don't try it yet, you can reference https://grafana.com/grafana/dashboards/13329
Posts in this Series
- GitLab Node.js SonarQube Integration
- Python Code Quality: GitLab, SonarQube, OWASP, Dependency-Check, and Essential Dev Tools Integration
- Run SonarQube on Linux Docker with Mono to scan .NET 4.8 Code
- GitLab SonarQube Integration with .NET
- Use Grafana to Manage SonarQube KPI
- Use Grafana to Manage GitLab CI/CD Pipelines
- Use GitLab to do .NET 4.8 CI/CD
- GitLab Checkmarx CI/CD Integration
- GitLab Checkmarx SonarQube Integration