使用 Grafana 管理 GitLab CI/CD Pipelines
文章目錄
本文更新紀錄
- 2022/10/13: 新增幾個步驟的檢查點
需求
當 GitLab 上的 project 一多, 好像不容易有個單一的進入點, 可以看到各 project 的 CI/CD Pipelines 狀況.
在 Grafana 上面顯示 GitLab CI pipelines
方案1: 使用 GitLab 內建的 metrics
- Exporter: GitLab 內建 (參考 https://docs.gitlab.com/ee/administration/monitoring/prometheus/)
- Grafana dashboard: https://grafana.com/grafana/dashboards/10620
- 這個 dashboard 需要安裝這個 plugin: https://grafana.com/grafana/plugins/grafana-polystat-panel/
- prometheus.yml
1- job_name: 'GitLab'
2    scrape_interval: 5s
3    metrics_path: '/-/metrics'
4    scheme: https
5    static_configs:
6    - targets: ['gitlab.xxx.xxx.xxx']
7    params:
8    token: ['***************']
方案2: 使用 gitlab-ci-pipelines-exporter
- Exporter: https://github.com/mvisonneau/gitlab-ci-pipelines-exporter 這個 exporter 提供好幾個面向的 metrics (搭配不同 dashboard)
-
Grafana dashboard: 和方案1是同一個 (也需要裝 Ploystat plugin)
-
啟動方式
-
假設你把 gitlab-ci-pipelines-exporter 的設定放在這 /opt/grafana/gitlab-ci-pipelines-exporter/gitlab-ci-pipelines-exporter.yml
1server: 2# [address:port] to make the process listen 3# upon (optional, default: :8080) 4listen_address: :9103 5gitlab: 6url: https://gitlab.xxx.xxx.xxx/ 7# You can also configure the token using --gitlab-token 8# or the $GCPE_GITLAB_TOKEN environment variable 9token: xrN14n9-ywvAFxxxxxx 10project_defaults: 11pull: 12 pipeline: 13 jobs: 14 enabled: true 15 environments: 16 enabled: true 17 18wildcards: 19- owner: 20 name: g1 21 kind: group 22 include_subgroups: true -
如果要直接跑, 可下這個指令, 把程式啟動在 docker
1docker run --restart always \ 2--name gitlab-ci-pipelines-exporter \ 3-v /opt/gitlab-runner/gitlab-ci-pipelines-exporter.yml:/etc/config.yml \ 4-v /etc/hosts:/etc/hosts \ 5--expose 9103 \ 6-p 9103:9103 \ 7mvisonneau/gitlab-ci-pipelines-exporter:v0.5.3 \ 8run --config /etc/config.yml -
若你用的是 docker-compose, 他的 yml 如下
1gitlab-ci-pipelines-exporter: 2image: mvisonneau/gitlab-ci-pipelines-exporter:v0.5.3 3container_name: gitlab-ci-pipelines-exporter 4ports: 5- 9103:9103 6expose: 7- 9103 8volumes: 9- /opt/grafana/gitlab-ci-pipelines-exporter/gitlab-ci-pipelines-exporter.yml:/etc/gitlab-ci-pipelines-exporter.yml 10- /etc/hosts:/etc/hosts 11environment: 12 GCPE_CONFIG: /etc/gitlab-ci-pipelines-exporter.yml 13 #GCPE_GITLAB_TOKEN: ${GCPE_GITLAB_TOKEN} 14 #GCPE_INTERNAL_MONITORING_LISTENER_ADDRESS: tcp://127.0.0.1:8082 -
檢查方式: 可檢查 http://your.server:9103/metrics, 然後你應該會看到一對長的像這樣的 metrics "gitlab_ci_pineline_xxxx" 如果你只看到 "gcpe_projects_***" 和 "promhttp_metric_handler_errors_total", 那這樣代表設定有問題, 沒有抓到值.
 1# TYPE gitlab_ci_pipeline_coverage gauge
 2gitlab_ci_pipeline_coverage{kind="branch",project="******",ref="master",topics="",variables=""} 0
 3gitlab_ci_pipeline_coverage{kind="branch",project="******",ref="master",topics="",variables=""} 0
 4# HELP gitlab_ci_pipeline_duration_seconds Duration in seconds of the most recent pipeline
 5# TYPE gitlab_ci_pipeline_duration_seconds gauge
 6gitlab_ci_pipeline_duration_seconds{kind="branch",project="******",ref="master",topics="",variables=""} 253
 7gitlab_ci_pipeline_duration_seconds{kind="branch",project="******",ref="master",topics="",variables=""} 489
 8# HELP gitlab_ci_pipeline_id ID of the most recent pipeline
 9# TYPE gitlab_ci_pipeline_id gauge
10gitlab_ci_pipeline_id{kind="branch",project="******",ref="master",topics="",variables=""} 811
11gitlab_ci_pipeline_id{kind="branch",project="******",ref="main",topics="",variables=""} 823
12......
-
-
prometheus.yml 如下
1- job_name: 'gitlab-runner-ci-pipeline' 2 metrics_path: '/metrics' 3 scrape_interval: 5s 4 scheme: http 5 bearer_token: bearer_token 6 static_configs: 7 - targets: ['xxx.xxx.xxx.xxx:9103'] -
成果
-
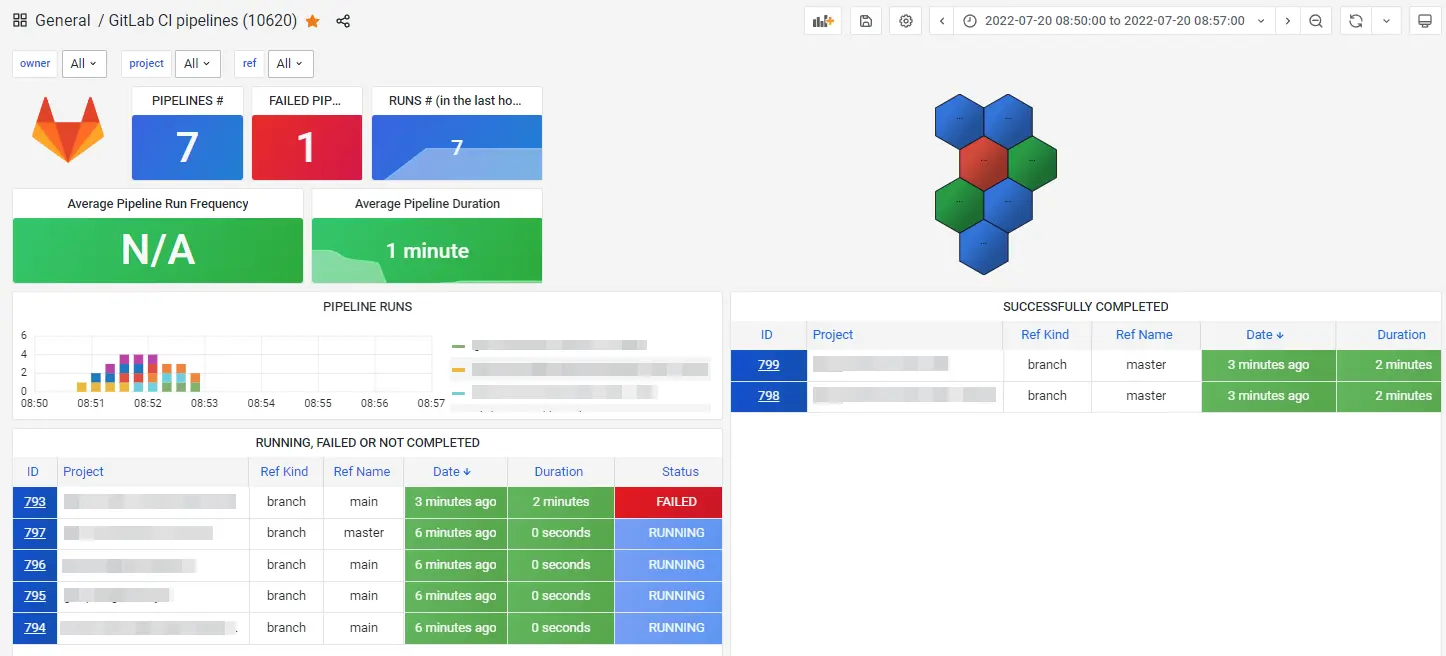
不論採哪種方案, 都是用同一個 dashboard, 看起來會如下
-
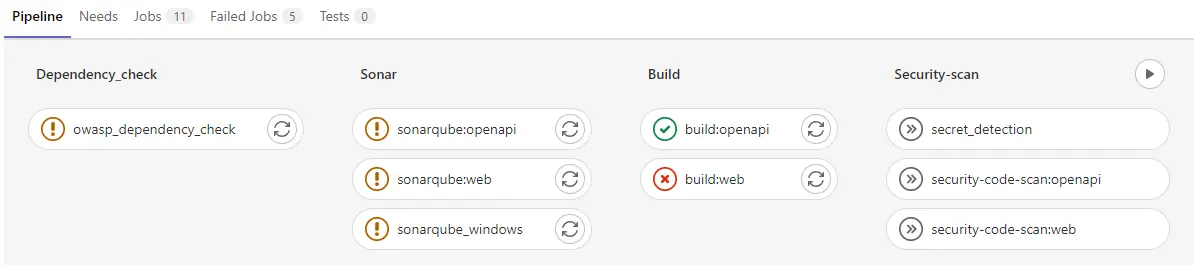
而且旁邊的 ID 點下去, 就會直接帶你到 GitLab 的 CI/CD Pipelines, 可以直接看到每個 job 的執行狀況.
-
看 CI Pipelines 裡面的 Jobs 的狀況
-
上面是看整個 CI pipelines, 如果要看更細到 job, 可在 gitlab-ci-pipelines-exporter.yml 加上下面這段. 配合的 Grafana dashboard 是 https://grafana.com/grafana/dashboards/13328
1# Pull jobs related metrics on all projects 2project_defaults: 3pull: 4 pipeline: 5 jobs: 6 enabled: true -
成果
- 成果如下, 可以直接看到每個 job 的執行結果和時間, 和上面的類似, ID 按下去也會直接跳到 GitLab CI/CD jobs.
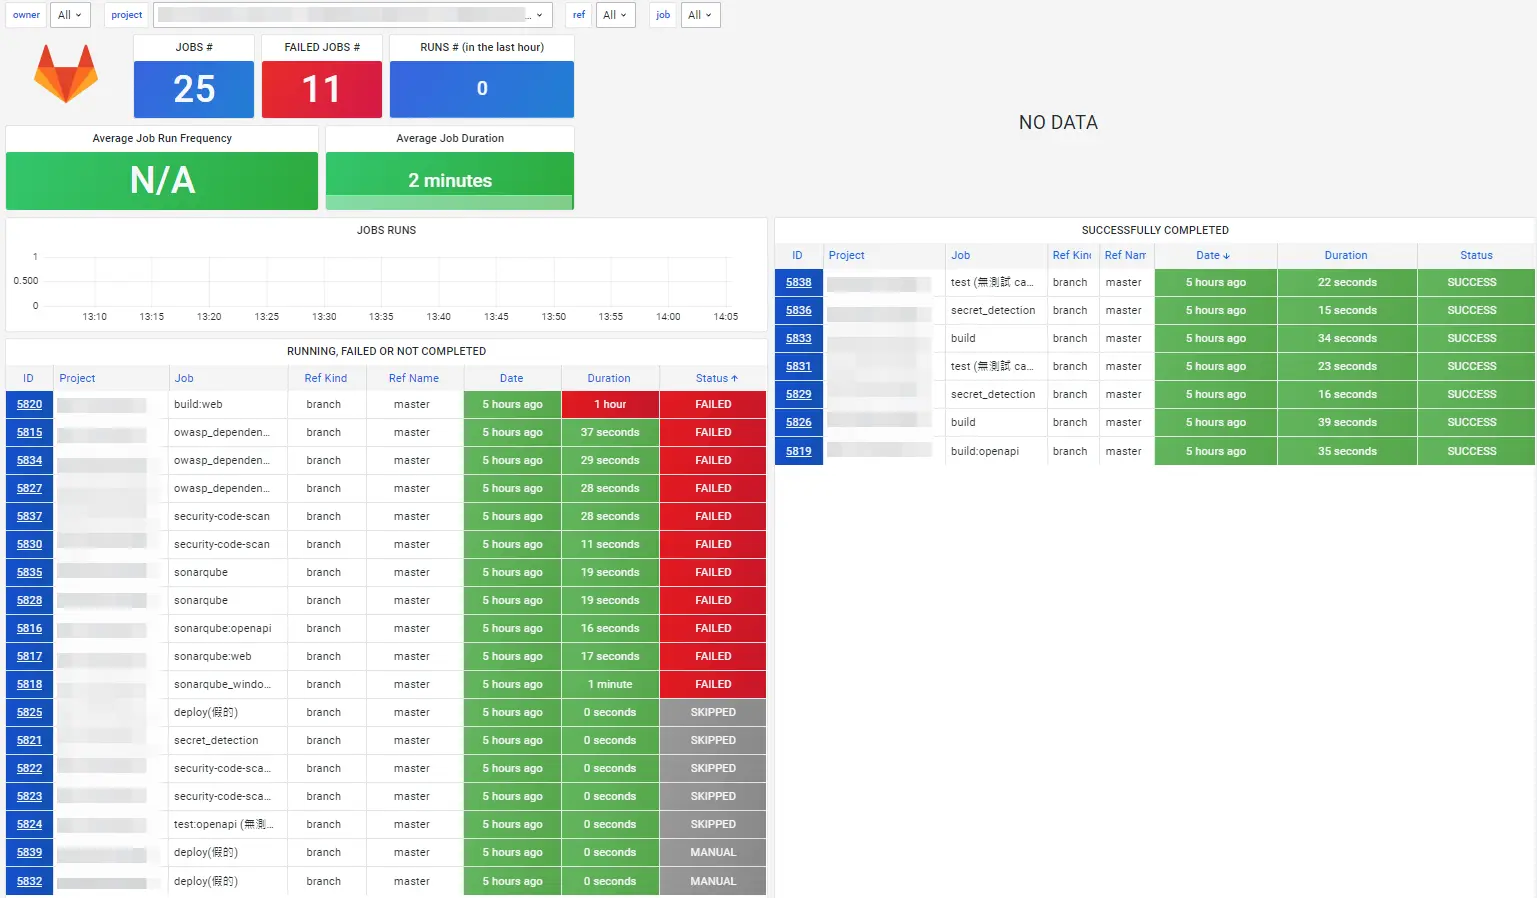
- 成果如下, 可以直接看到每個 job 的執行結果和時間, 和上面的類似, ID 按下去也會直接跳到 GitLab CI/CD jobs.
看 Environments / Deployments 的狀況
這個我還沒試, 有興趣可參考 https://grafana.com/grafana/dashboards/13329